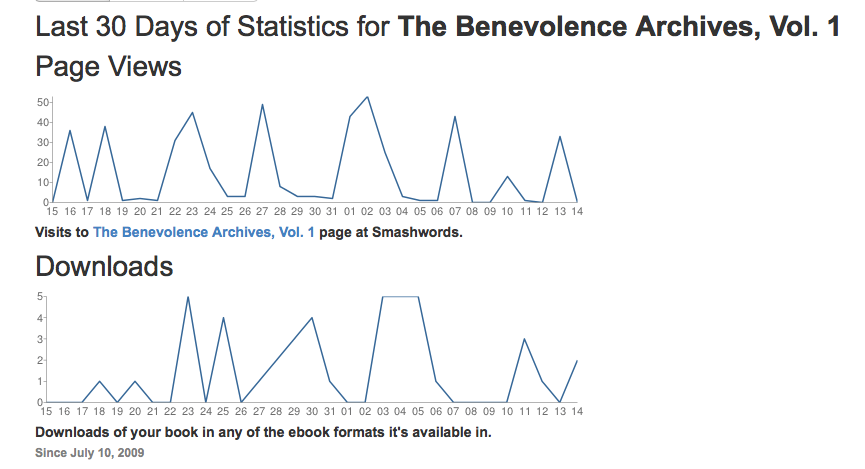
This graph.
Make it make sense.
‘Cuz I don’t get it.
Discover more from Welcome to infinitefreetime dot com
Subscribe to get the latest posts sent to your email.
The blog of Luther M. Siler, teacher, author and local curmudgeon

This graph.
Make it make sense.
‘Cuz I don’t get it.
Subscribe to get the latest posts sent to your email.

They look like dinosaur teeth? Rar!
Other than that, I gots nothin.
LikeLiked by 2 people
The bottom one means you’ve sold at least 37 more books than me 🙂
LikeLike
I THINK I see the problem: The scale is not the same for each part of the graph. The page views are marked by tens on the left side of the graph; but the downloads are marked by ones.
LikeLiked by 1 person
The issue I see is that none of the peaks match. I appear to only get downloads when I DON’T get pageviews which doesn’t make sense.
LikeLike
Write down next to each other the heights of the graphs at each corner (for each day.
This is a very stupid way to draw a graph. Would be better like the page view/visitors graph in mystats, as bars.
LikeLiked by 1 person
Here’s my attempt:
This shows a correlation ( relationship) between the total number of visitors you have and the total number of number books that are purchased.
Example:
Dates: 31-1
change in the number of visitors: 41-0= 41 visitors
change in the number of days: 1st-31st= 1 day
slope (or ratio of visitors to days) : 41 visitors/1 day
change in the number of purchases: 0-1= -1 purchase ( a decline in the number of purchases)
change in the number of days: 1st-31st= 1 day= 1 day
slope (or ratio of purchases to) : -1 purchase /1 day
ratio of change( number of purchases/ number of visitors per day )= -1 purchases :41 visitors
The ratio of change should tell you how the number of visitors impacted your sales on a given range of time. In other words the number of visitors that converted into customers.
It may be tempting to simply divide total purchases by total number of visitors, however, determining your day by day conversion rate you can better identify the best sort of traffic for your sales.
Hope this helps.
LikeLiked by 1 person
Let me be a trifle more specific, since people seem to be taking this seriously: it seems reasonable to believe that days where I have a lot of pageviews are likely to be days where I have lots of sales, yes? That is not what is happening here– in fact, I seem to just about only have sales on days with little to no pageviews. Today, for example: two sales, no (or possibly one) pageview. Which is not possible.
The only thing I can think of is that Smashwords is delaying reporting sales for 24 hours but reporting pageviews on time; slide most of the sale peaks back a day and they make a bit more sense, but it’s still not perfect.
LikeLiked by 1 person
Ummmm … people view the page, think about it for a while and then buy … that’s about all I got.
LikeLiked by 2 people
I believe Smashwords’ sales reports are delayed for all vendors, including themselves, but Page Views are in real time. You can find out more specifics via Ted Summerfield’s Punzhu Puzzles’ SW blog http://punzhupuzzles.wordpress.com, one of the SW FB or G+ groups, a SW forum, or directly to SW HELP and find out more.
Best to you!
Sally (also a SW author)
LikeLiked by 1 person