Let’s start with the good news: traffic was up by two-thirds this year, and depending on how the next two days go this was either the second-best or the third-best year in the history of the site:

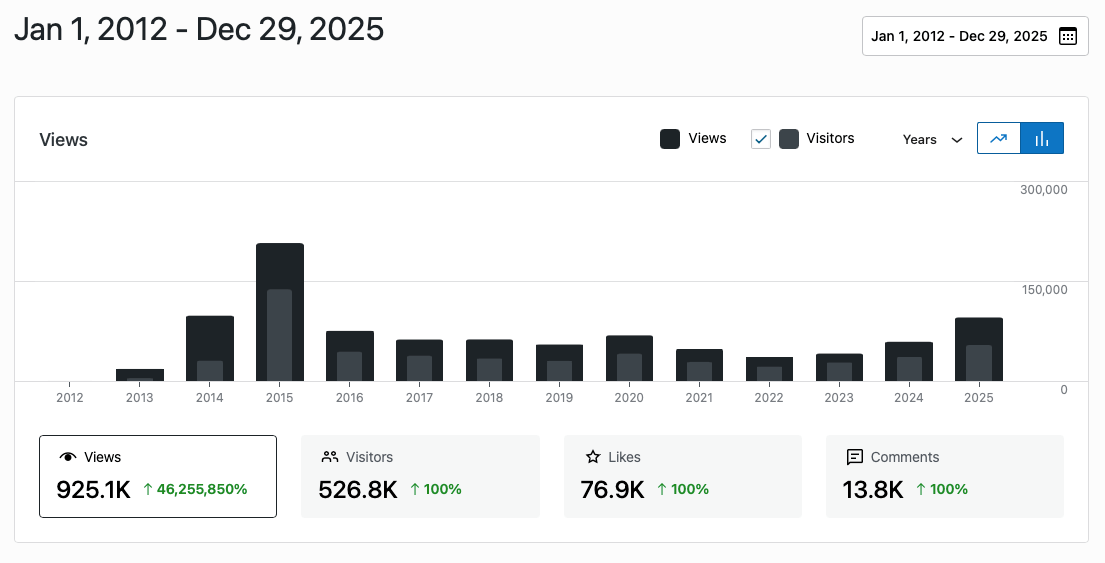
We’re still not reaching the heights of 2015, and “In which I tell you how your religion works,” the reason for that huge spike, still sits atop all of my other posts at 113,306 views. Most of the rest are from the Creepy Children’s Programming series and, of course, The Fucking Snowpiercer Post.
Here’s the problem: a large proportion of those views are probably Chinese bots. Why does China care so much about my stupid little website? I have no clue. Why did it start this year? Also no clue. But given that none of my site is in Chinese and I’ve never really discussed anything of particular interest to Chinese citizens, I have a hard time making this geographical distribution make sense:
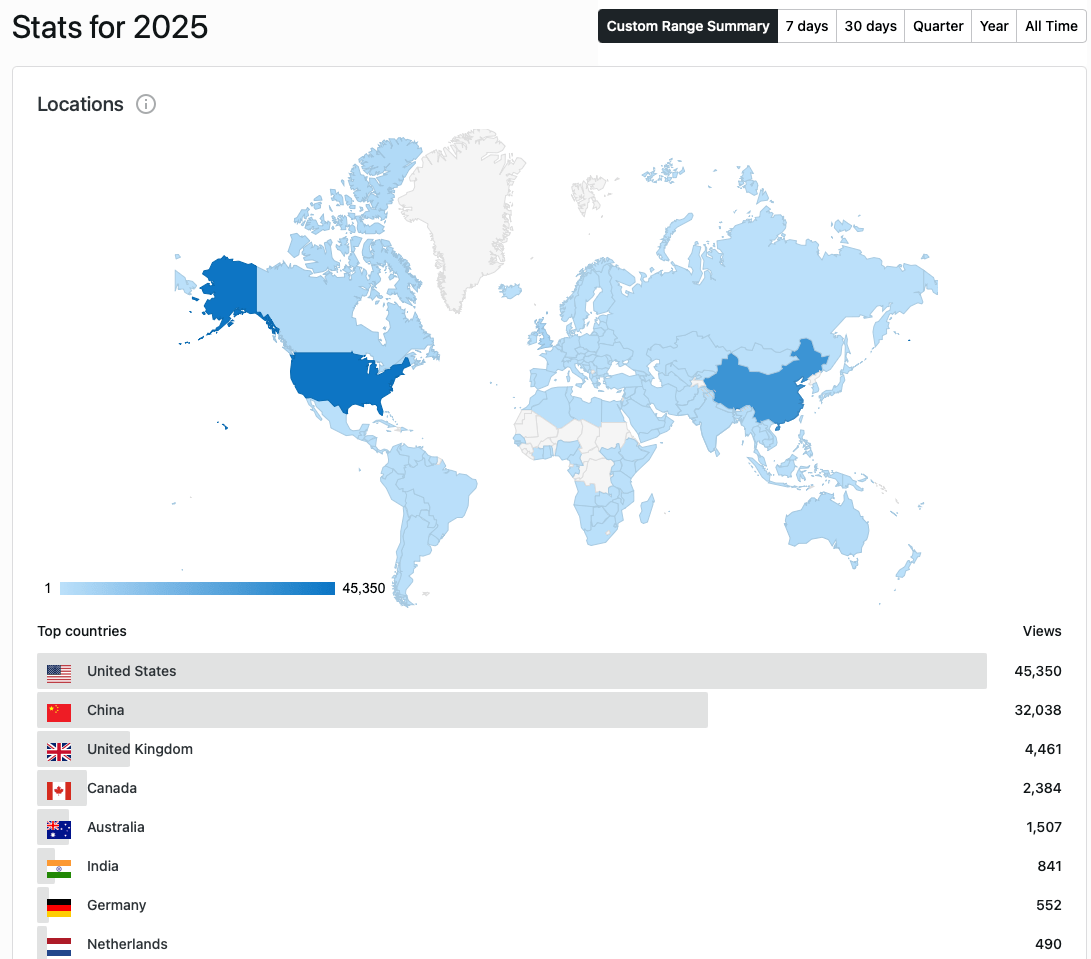
Worth pointing out: even if you subtract all those Chinese hits out, I’m still up from last year, the fourth year in a row of increased site traffic. It’s just not nearly as impressive. 🙂
Here’s the lifetime geographical distribution, which is about as full as it’s ever going to get, I think:
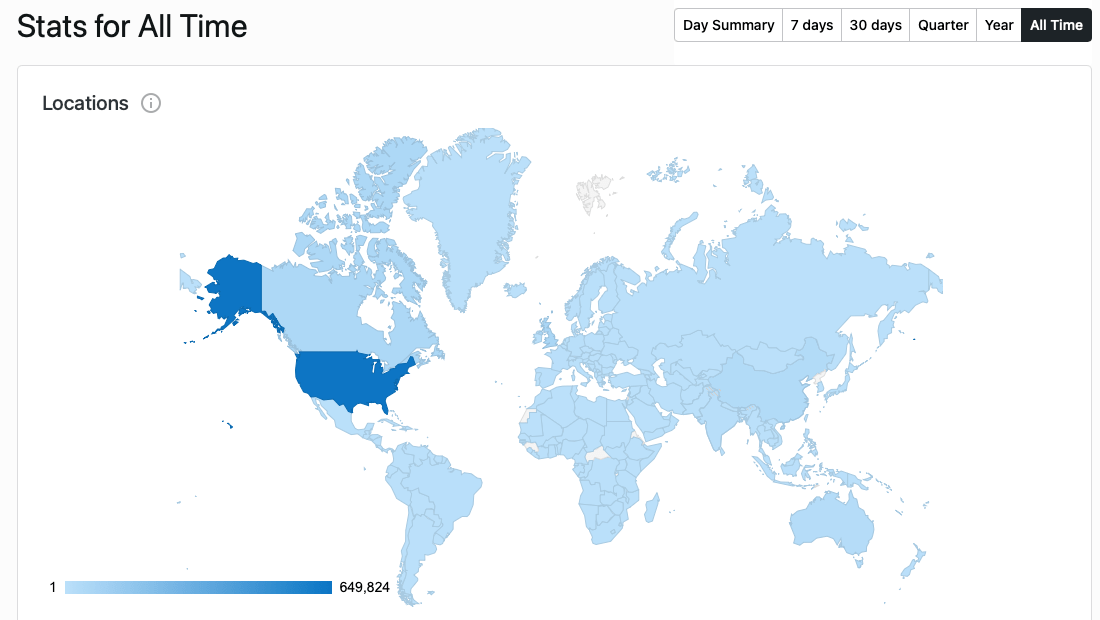
That white island at the top of the map is Svalbard, which belongs to Norway, and beyond that, we’re looking at North Korea and, frankly, a handful of places that either barely or flat-out don’t have governments: Western Sahara, the Central African Republic, Guinea and Eritrea. Any other missing spots are literally too small for me to be able to pick out of the map.
Here’s how much Chinese traffic I had this year: WordPress just started showing us city data in 2025, and eight of the top twenty cities are in China, including Beijing at #1– I got 2 1/2 times more traffic from Beijing than I did from the city I live in. London, Sydney and Toronto are the first three cities outside of China or the US to show up on the list. We’ll see how much this jumps around next year.
This post will mark 653 days in a row of blogging.
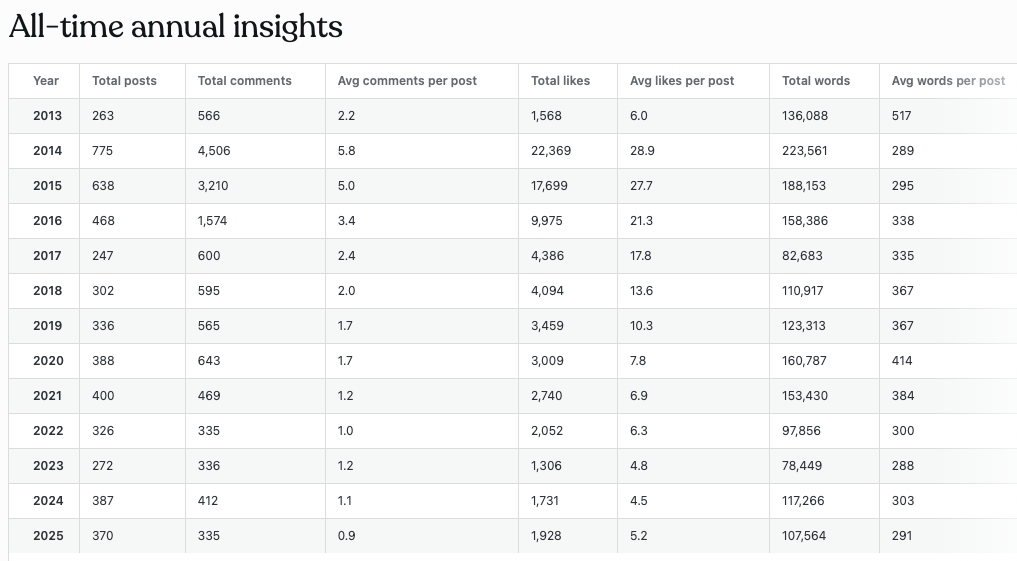
Interaction continues to drop, sadly– well, likes are up slightly, but comments are down, and I feel like comments are more important– and my word count was a little bit down from last year. At just over 1.7 million words over the lifetime of the blog, I’m closing in on that two millionth word:
Obviously I’m not going anywhere; I don’t have anything in the way of specific plans for the future around here other than to keep writing, although I’m considering making the jump from WordPress’ Premium hosting, which I’ve been using for more or less the entire time the blog has been active, to their Business tier. I make enough money now that dropping $300 a year on the site doesn’t feel completely stupid, if only for increased access to stats (I love numbers, as you can see) and better control over how the site looks. We’ll see. January’s a three-paycheck month so I might as well blow some of it, right?
Anyway, if you’re seeing the traffic from China too, let me know– I know of one other WordPress person who has mentioned high Chinese traffic on a mostly-defunct blog, but only the one at the moment. It would make so much less sense if it was just me, y’know?


 I was already not in the greatest of moods when I got home this afternoon; I spent the afternoon struggling to fix my parents’ laptop, a task I should have tackled weeks ago and I am starting to suspect is actually a world-class trolling attempt on Microsoft and Sony’s part, because no one could ever possibly think that Windows 8 is a real operating system.